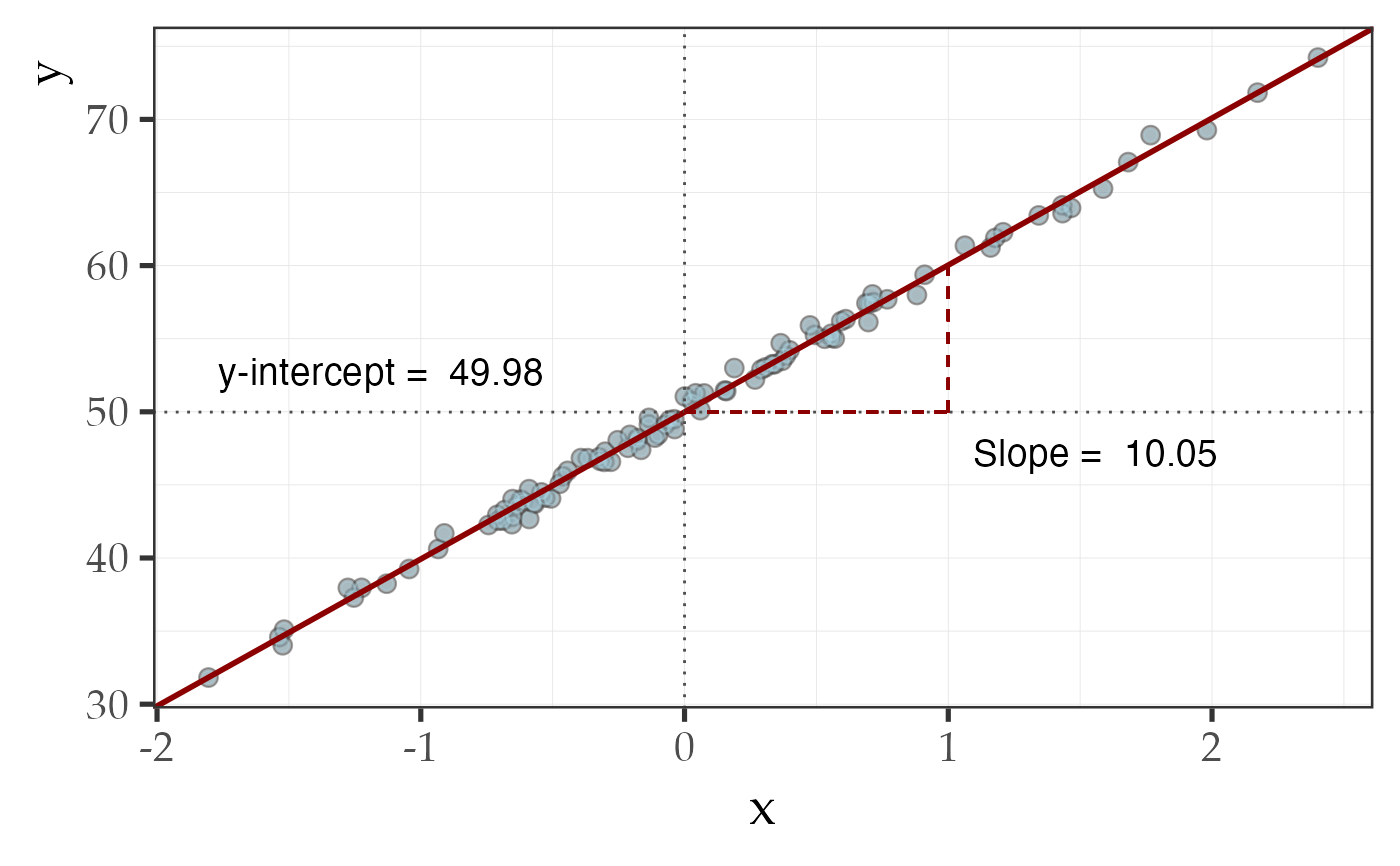
This function takes user inputs, creates a data frame, fits a linear model, and plots the output. The function can take 4 optional arguments that adjust the relationship between x and y. The purpose of this function is to help teach the linear model.
lm_ex(
  n = 100,
  intercept = 50,
  slope = 10,
  sigma = 0.5,
  custAxis = FALSE,
  xlim = NULL,
  ylim = NULL
)
Arguments
| n | Number of observations |
|---|---|
| intercept | The y-intercept |
| slope | The slope the line |
| sigma | Spread around the mean |
| custAxis | Logical. Set to true to use custom xlim/ylim |
| xlim | Vector for x axis, 'custAxis' must be TRUE. |
| ylim | Vector for y axis, 'custAxis' must be TRUE. |
Examples
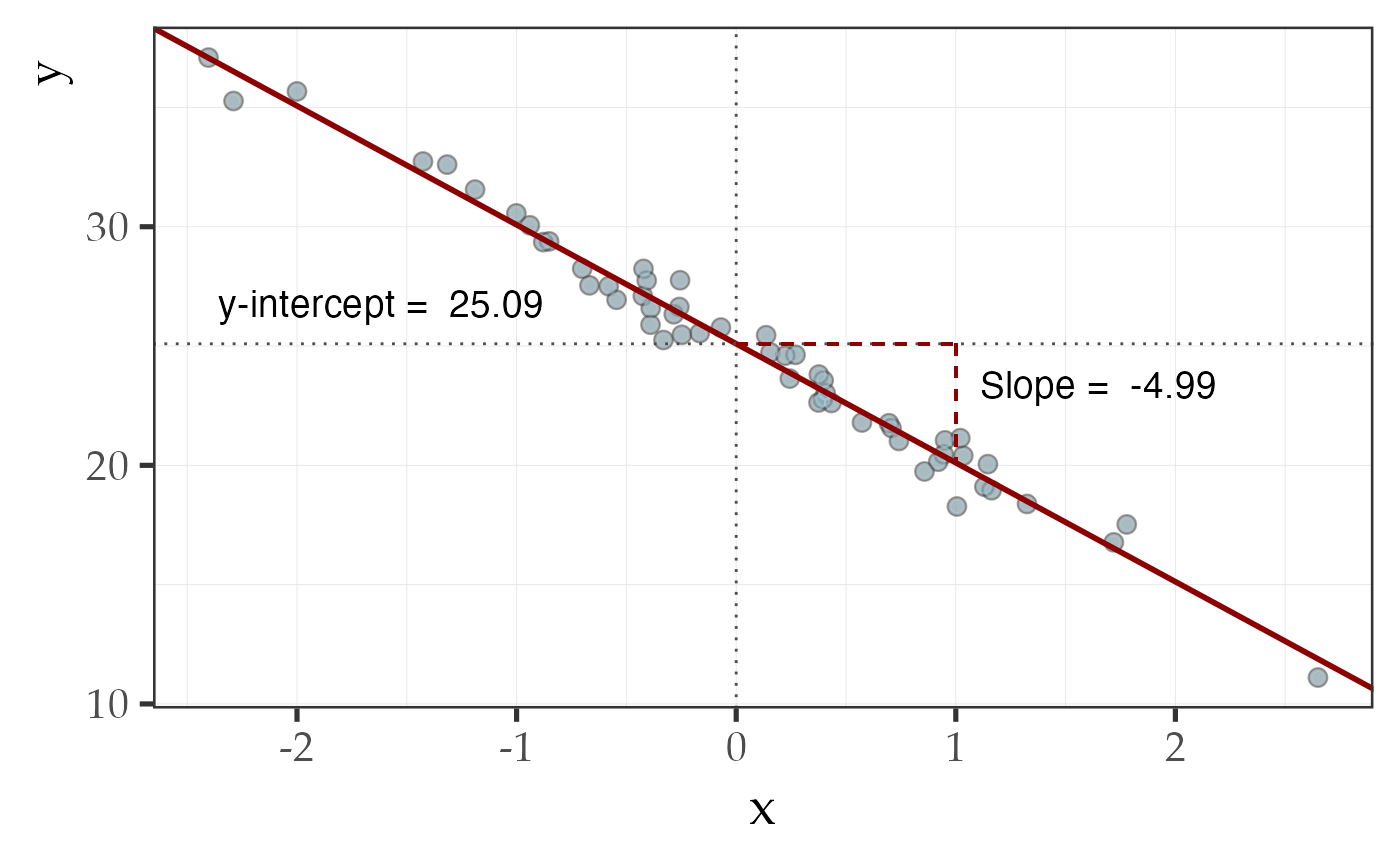
# 'y' as a function of 'x' with 100 observations, intercept # of 50, slope of 10, and sigma at 0.5 lm_ex()# Negative slope lm_ex(n = 55, intercept = 25, slope = -5, sigma = 0.75)