This function generates a series of plots that can be used to check some model assumptions in linear models.
diagnosis(mod)Details
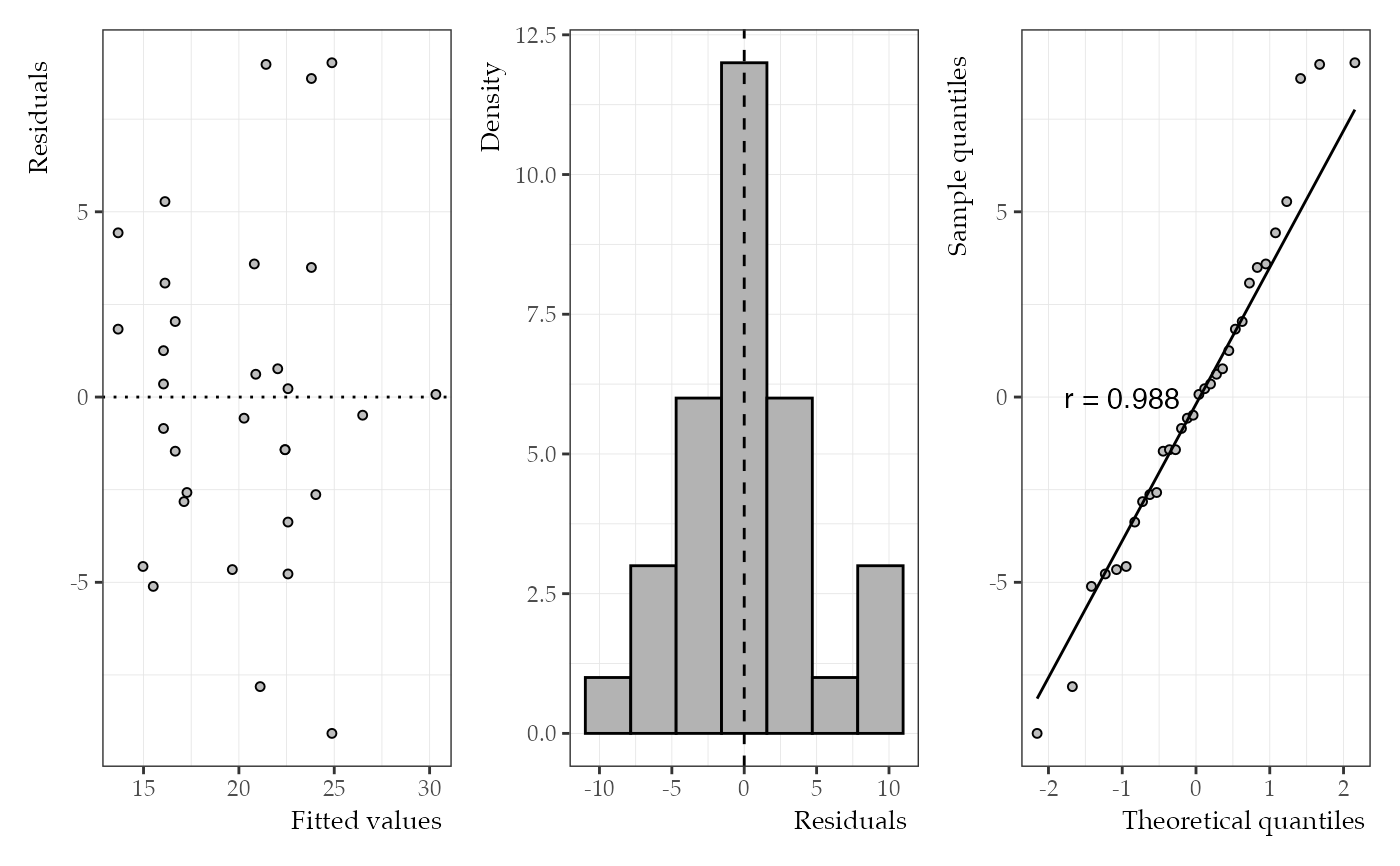
The left panel shows residuals as a function of fitted values and is useful for checking homoskedasticity.
The middle panel plots a histogram of the residuals with a vertical discontinuous line that represents the mean.
The right panel provides a qq-plot of the residuals.
Examples
mod1 <- lm(mpg ~ drat, data = mtcars)
diagnosis(mod1)