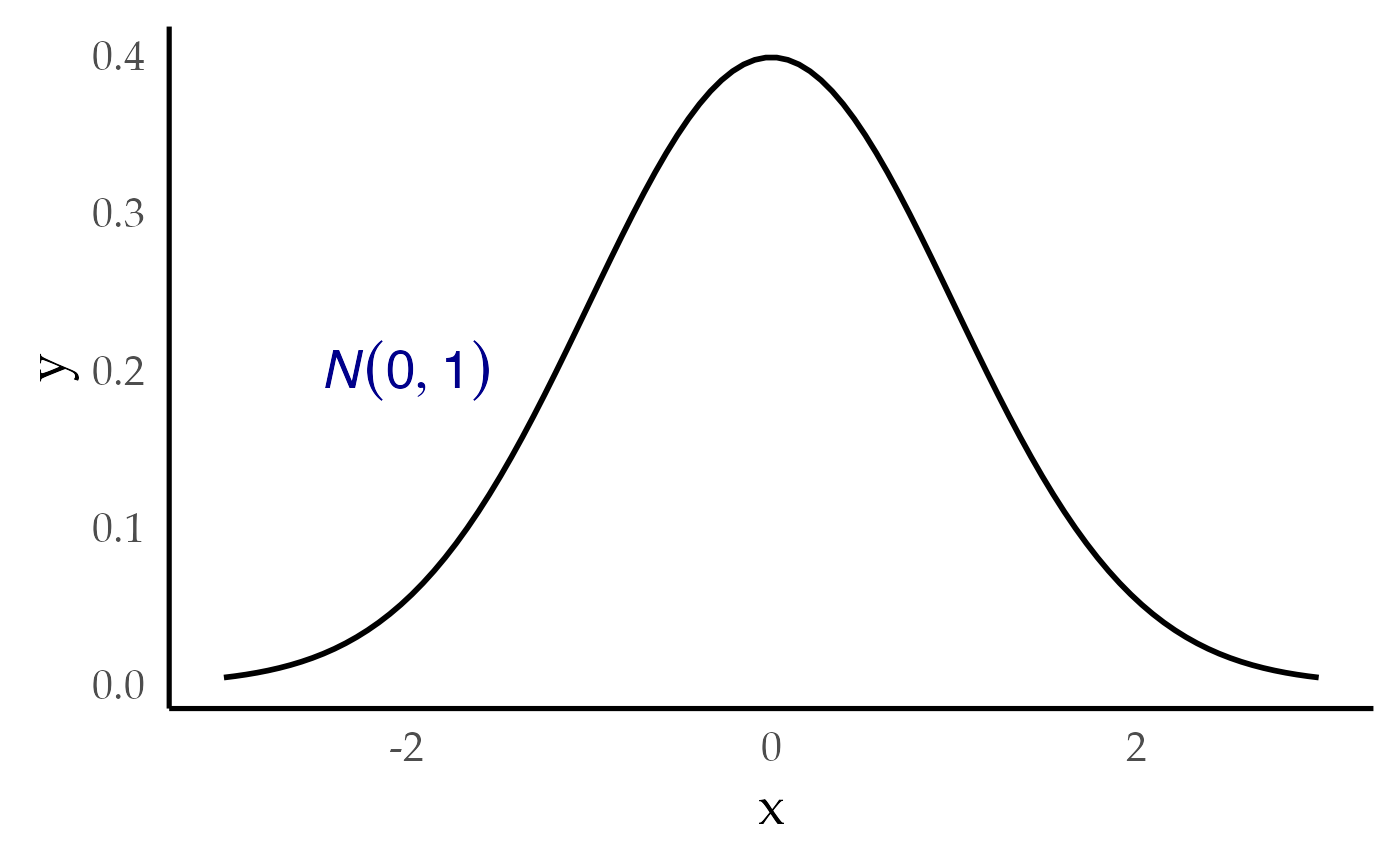
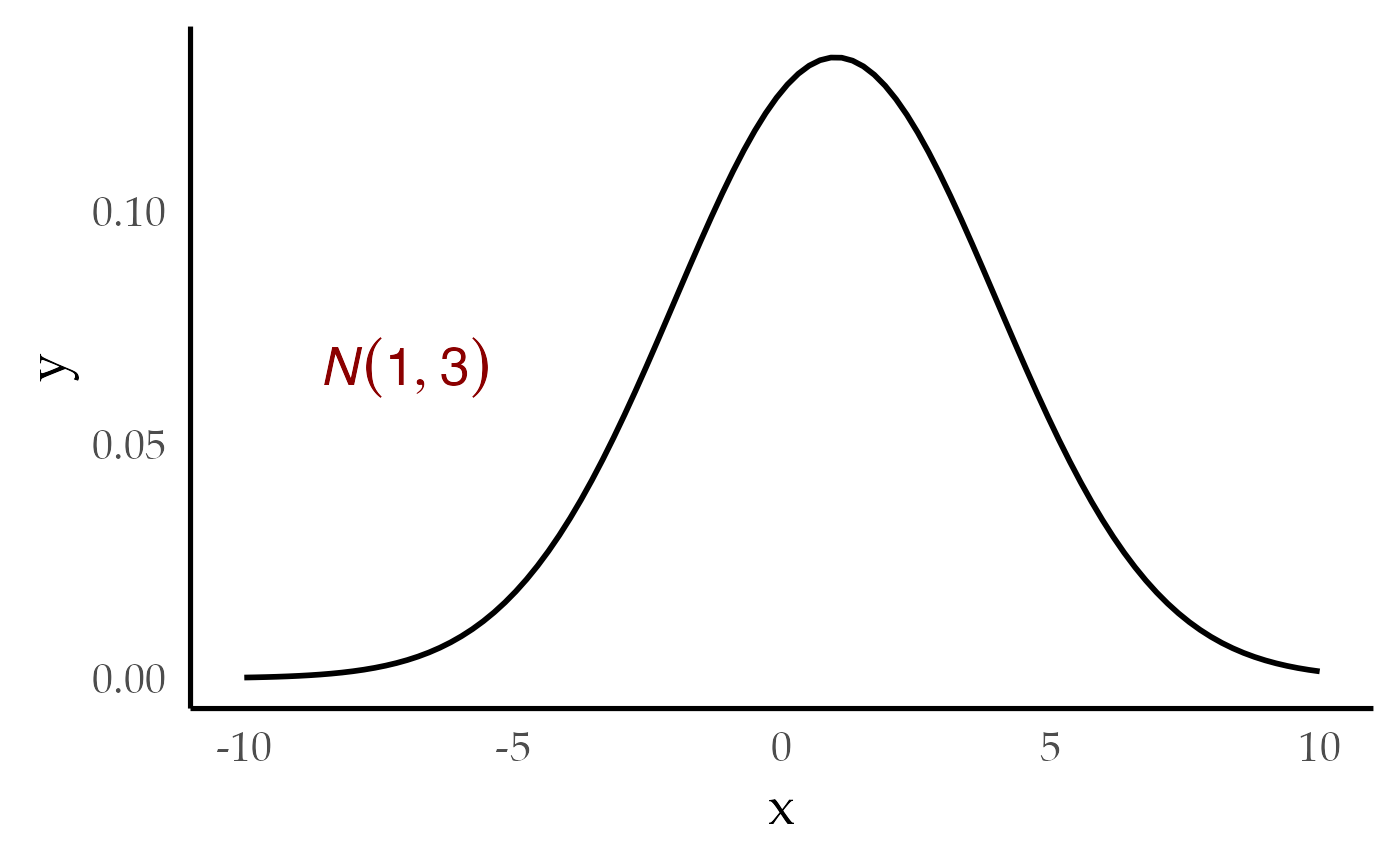
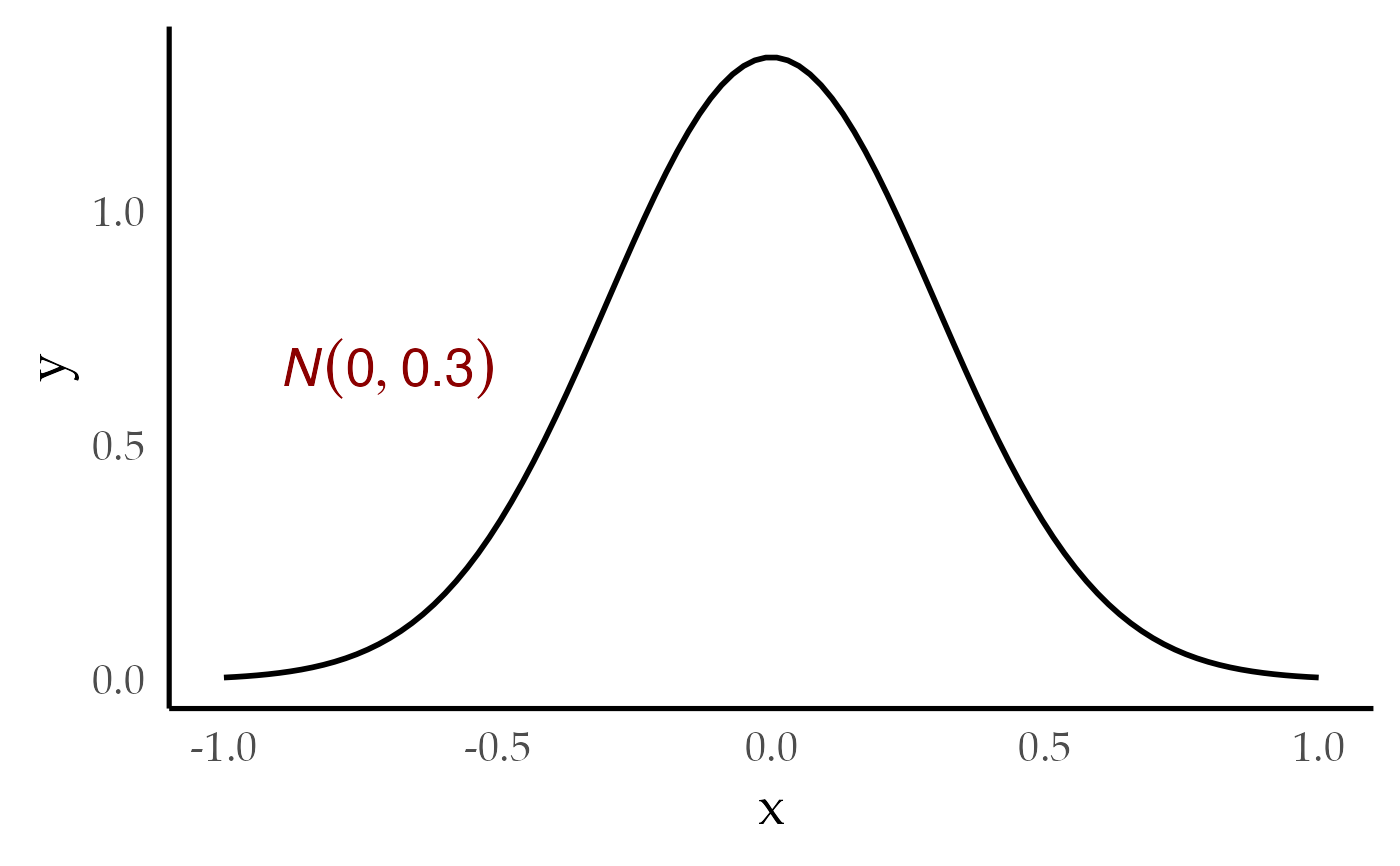
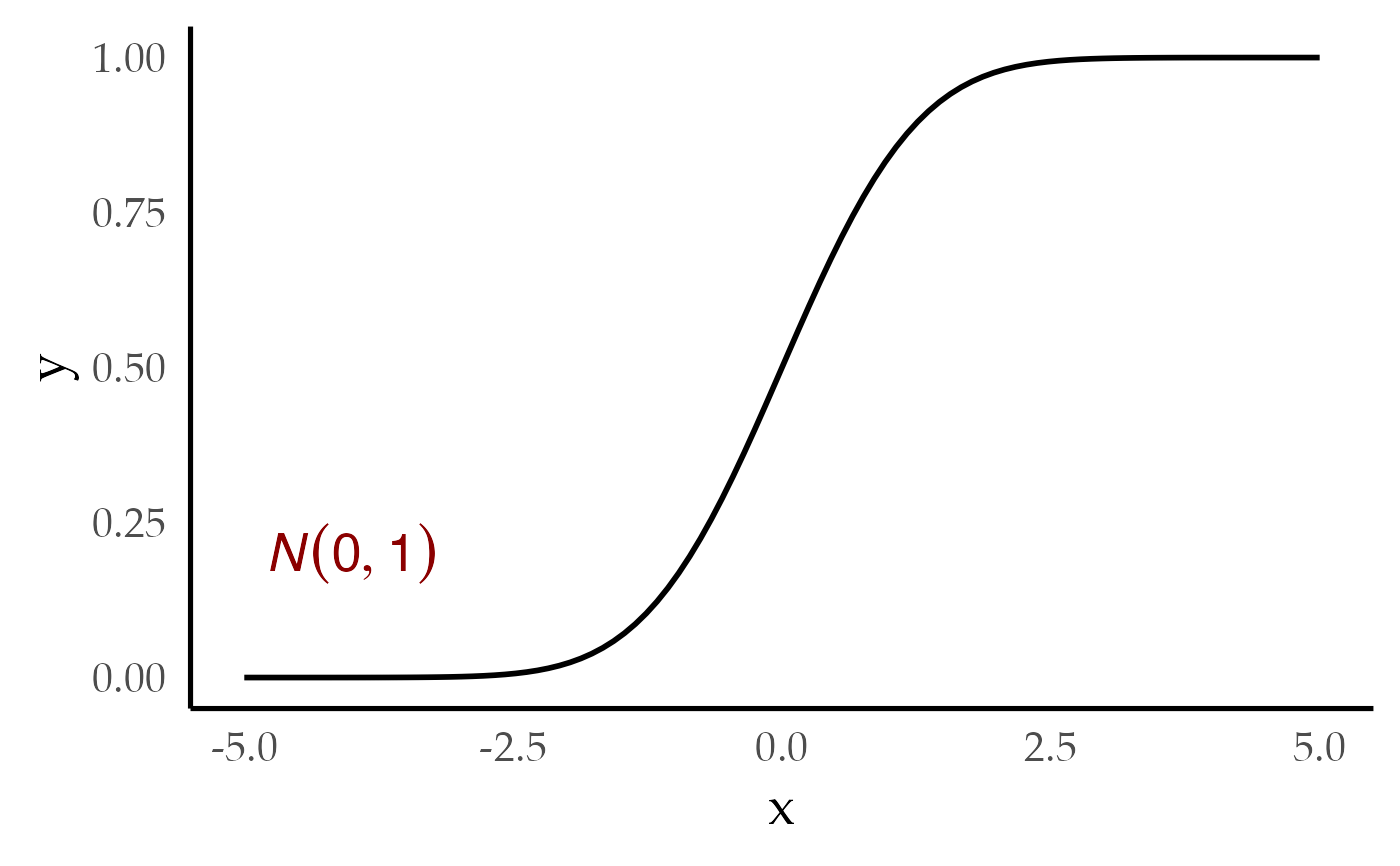
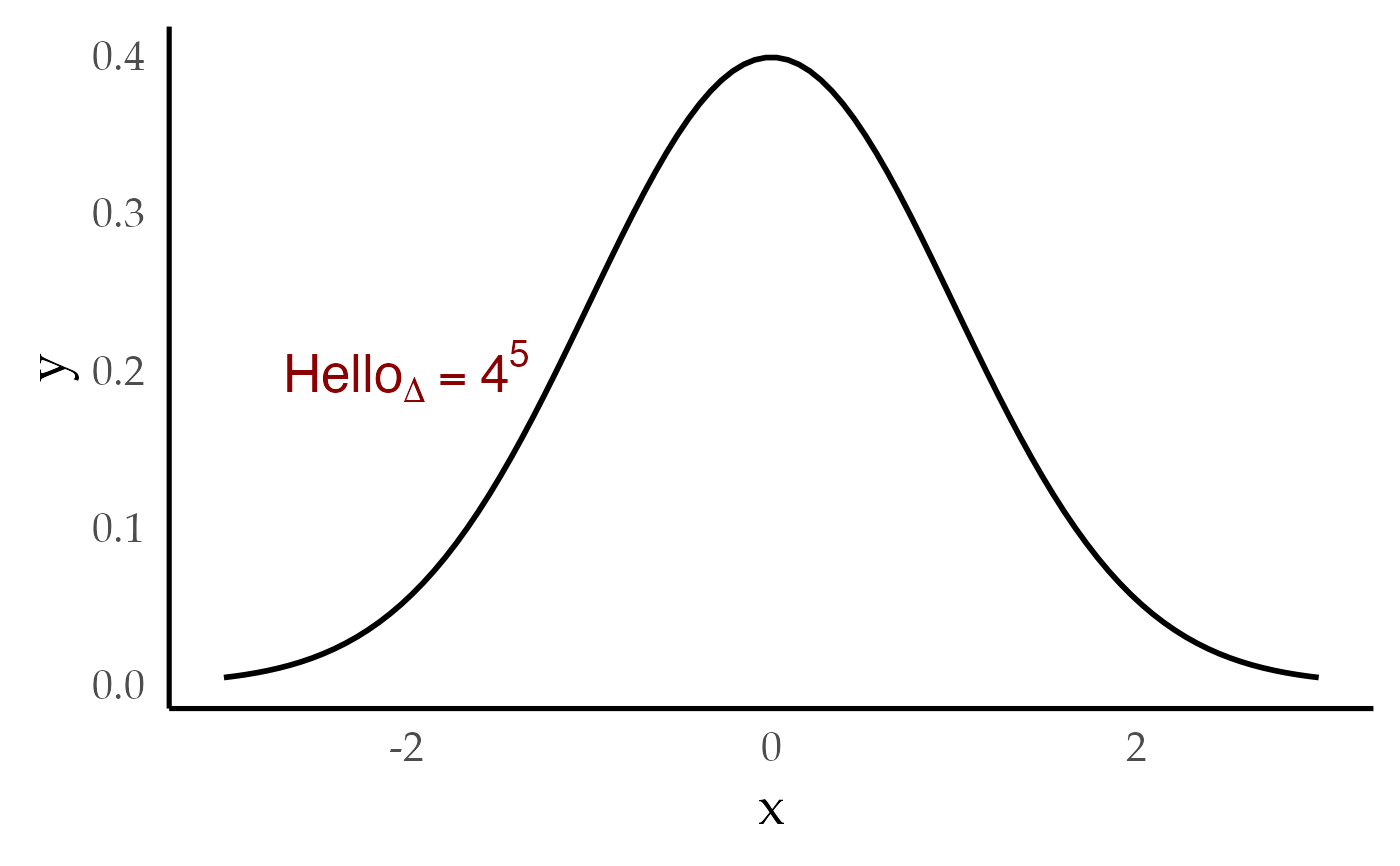
This function generates a plot of a normal distribution using user supplied mean and standard deviation.
plot_dist(distribution = "gaussian", range = c(-3, 3), mean = 0, sd = 1, ...)Arguments
- distribution
A distribution type (defaults to gaussian)
- range
A vector of 2 values indicating the range for the x-axis and the data
- mean
A numeric value for the center of gravity of the distribution (defaults to 0)
- sd
A numeric value for the standard deviation of the distribution (defaults to 1)
- ...
Arguments to be passed to ggplot. Specifically 'font_color' and 'tex'.
- plot_dist
A function for plotting normal distributions