library(phonTools)This is how I made the colored spectrogram from the homepage (it’s me saying ‘welcome’). You need to load the package phonTools into R.
Now you have to load the sound you want to make a spectrogram of (it has to be in your working directory). I recorded mine in Praat.
sound <- loadsound('welcome.wav')Now we’re ready to make a spectrogram.
spectrogram(sound, fs = 44100, colors = TRUE,
            maintitle = "Welcome", maxfreq = 5500)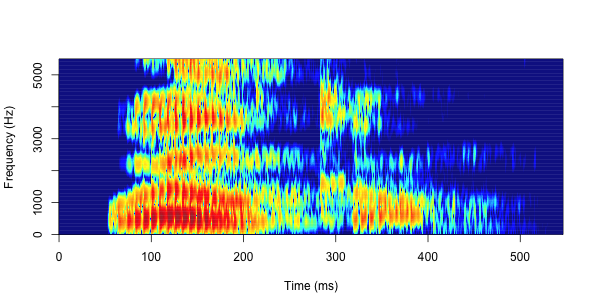
We can also see the oscillogram by using
plot(sound)
That’s it.