Overview
This mini tutorial is part II about incorporating tikzDevice into your workflow. It explains the file structure necessary to successfully include tikzDevice plots into your \(\LaTeX\) document. You must first have tikzDevice installed. If you don’t, see part I for more information.
The structure
A simple yet effective way to do reproducible research is to use R (for statistical analysis) directly in a \(\LaTeX\) environment. There are two ways to accomplish this: (1) Sweave and (2) knitr. knitr seems to be the better choice, as it builds on some of the deficiencies of Sweave, and is what I am currently using in my workflow. In order to successfully “knit” R code into a .tex format we must use a no-web (.nw) file to create the .tex file. There are two types of no-web files: .Rnw and .Snw. I am not completely sure what the differences are between then, but I use .Rnw and that is what I will mention in this tutorial.
The first step is to create a project folder. For the purposes of this tutorial let’s call this folder “master”. Next, we will need some data and some R code that analyzes it. The most common, no-hassle way to accomplish this in R is to save your R code in a separate .R file. For this tutorial, we will call our data “my-data.txt” and our R code “example.R”. The fake data we are going to analyze is for a two-alternative forced choice identification experiment. So, our fake data is in the “my-data.txt” file and the R code that analyzes it is in the example.R file.
The next step is to create the “no web” .Rnw file. This is as simple as creating a document in your text editor of choice (I use TextMate 2 and Sublime Text 3) and saving it with a .Rnw extension. For this tutorial we will call this file “example.Rnw”. Its purpose is to call the R code written in “example.R” (which uses the fake data in “my-data.txt”) in order to produce a .tex file (in this case “example.tex”). Still with me? Good.
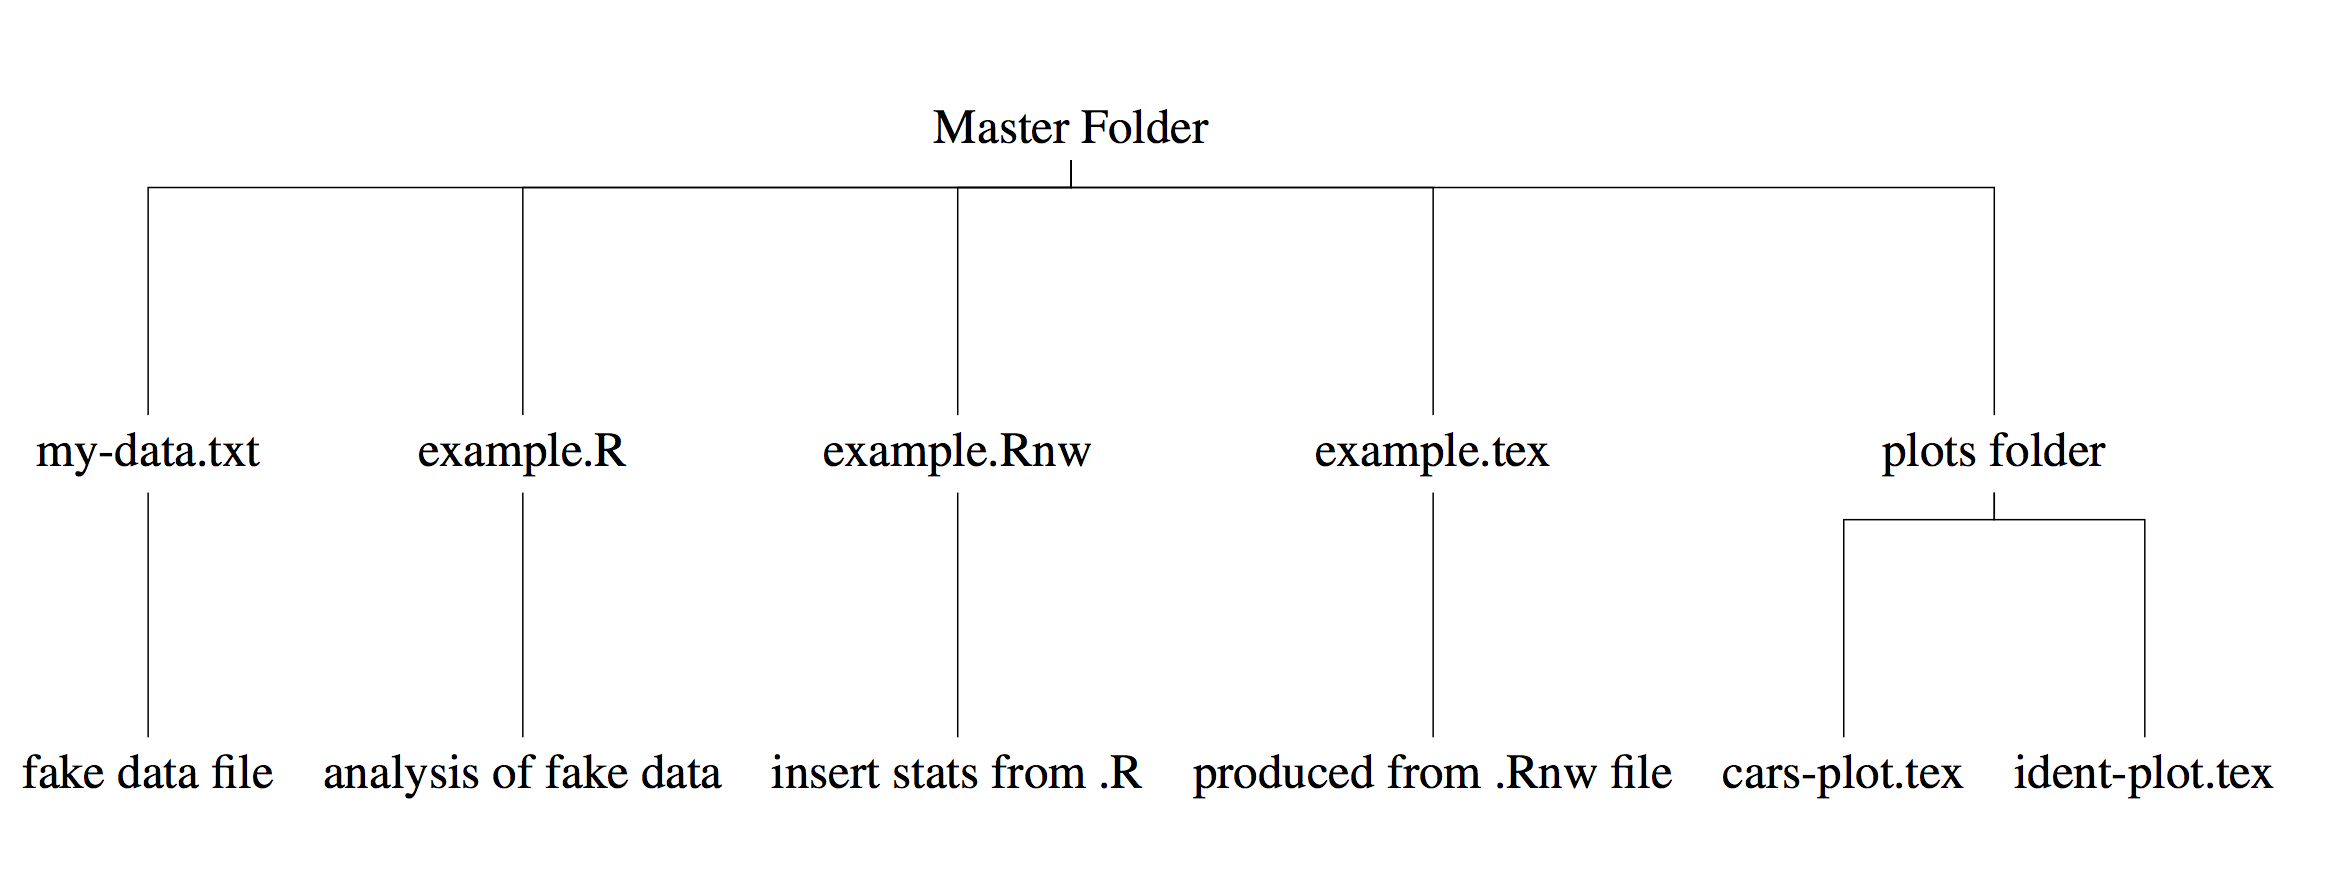
Next we need to prepare where we are going to keep the plots produced by tikzDevice. I find it most convenient to have a specific folder, “plots_folder”, where I only keep the tikzDevice plots. So, create this folder inside the “master” folder. tikzDevice creates the R plots and converts them to a \(\LaTeX\) format (the benefits of this are further explained in part III of this tutorial), saves them in “plots_folder” and we will then include them in the example.tex file which can be compiled into a PDF. The image below shows what this should look like when it’s all said and done.
Check out part III to learn how to create standalone plots that can include IPA sybols.