# create fake data
# to save in google sheet

set.seed(1)
df <- data.frame(
    subj = 1:30,
    group = gl(2, 15, labels = c("mono", "bi")),
    score = c(rnorm(15, 87, 8), rnorm(15, 94, 3))
)Google Forms offers a convenient way to collect data online. It is particularly useful because you can embed the form in a webpage, link the results with a spreadsheet and publish the results online. This post shows how to scrape the data from the spreadsheet (google form) in r using the package RCurl. You should be able to follow along by copying and pasting the code into an R session.
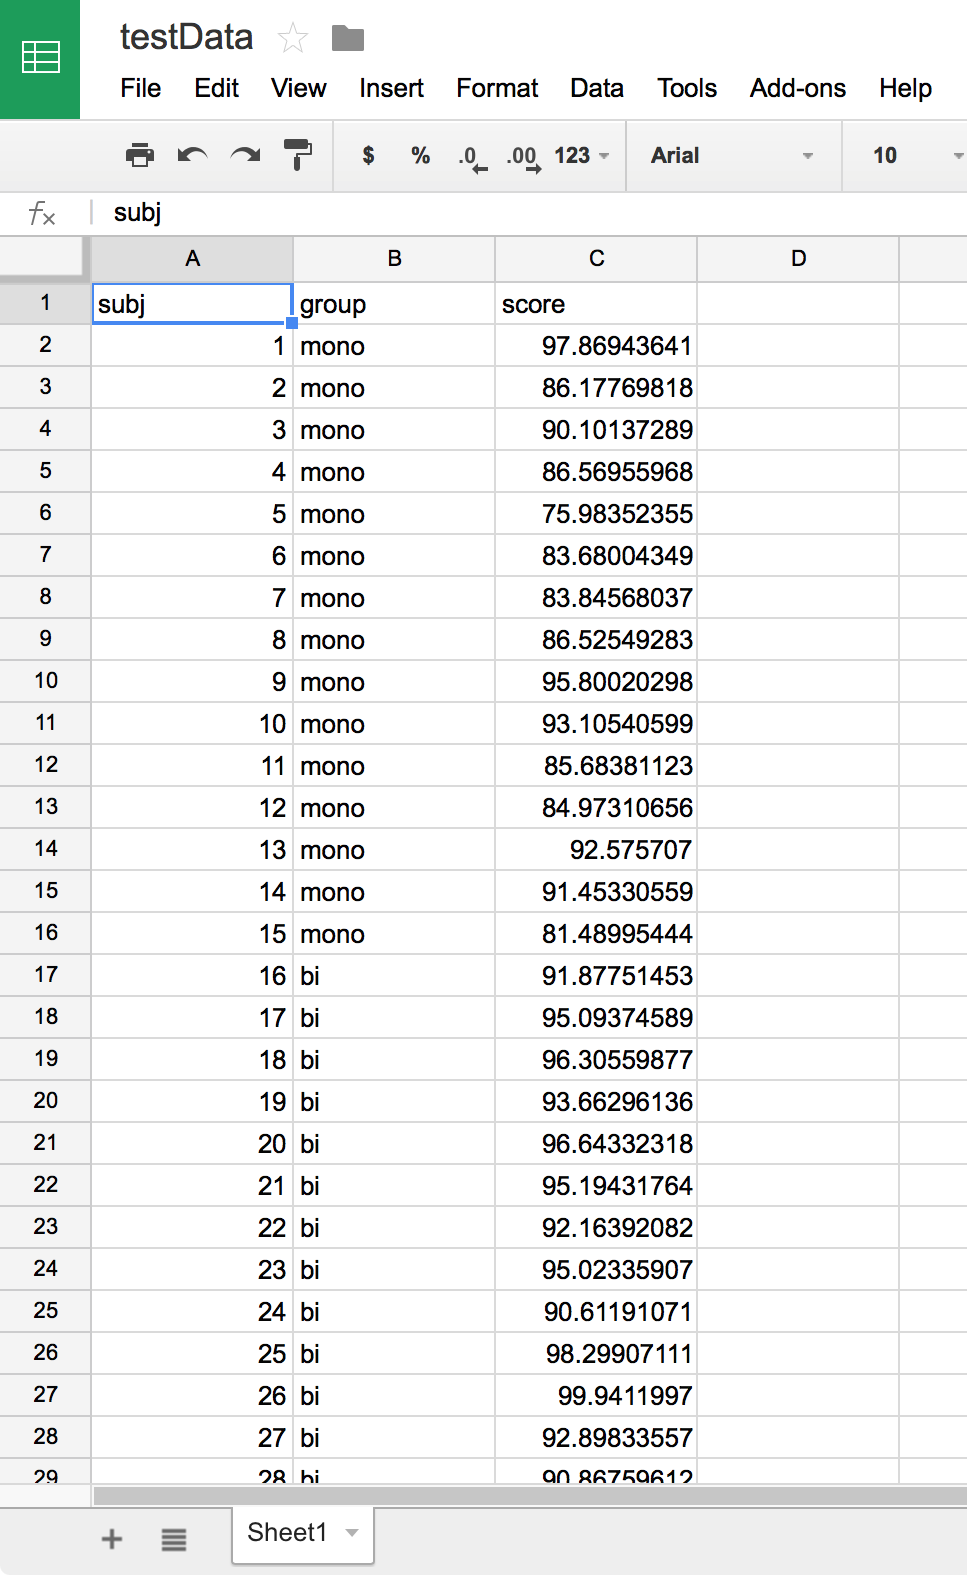
Ideally you can use this method once you have collected data using a google form. For our purposes I just created a google sheet and I will scrape the data from there.
Get some data
To show how this works, I simulated some data with the following code:
I then copy and pasted the data frame into a google sheet. To do this, open google drive and create a new sheet.
Once you have some data in a sheet you need to do a few things before you are ready to fire up R.
First, you need to publish your sheet to the web (File > Publish to the web…):
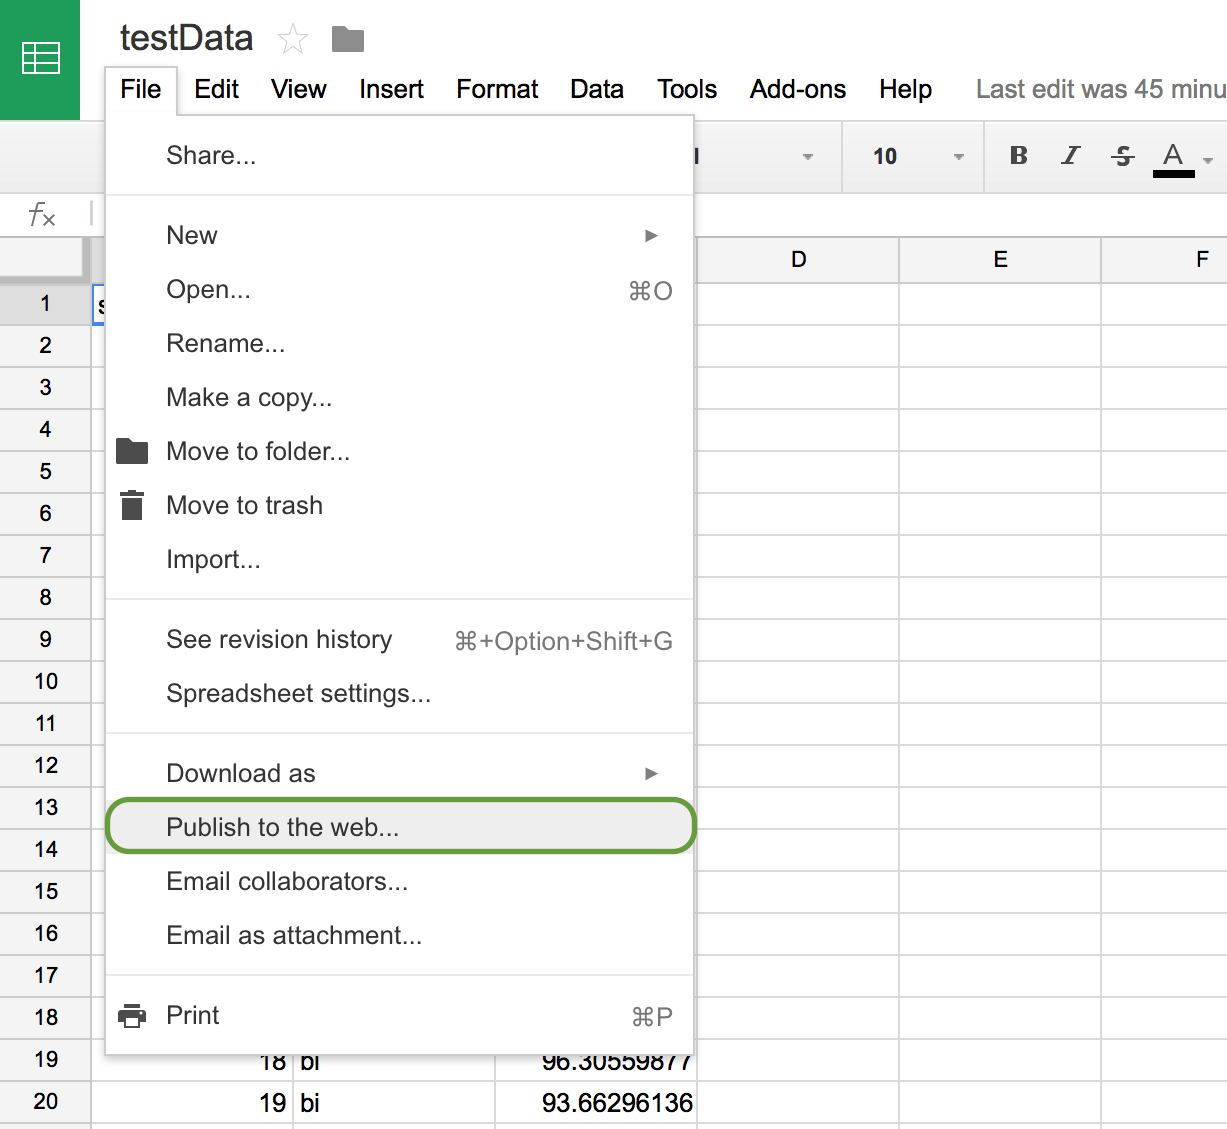
Publish the sheet and copy the public link from the window.
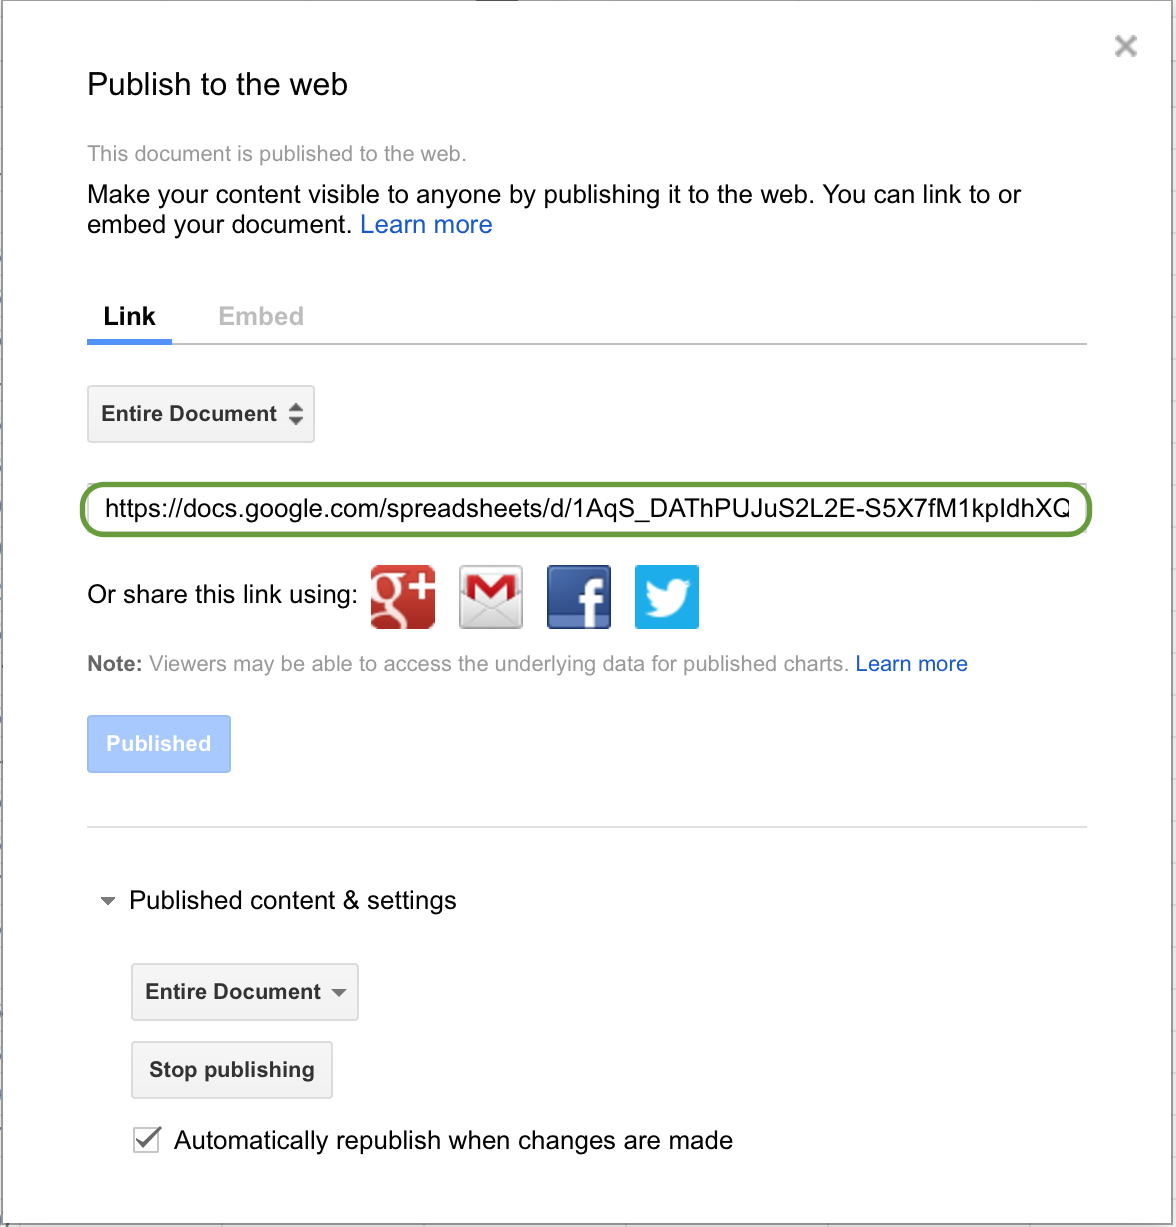
As you can see, my link is:
https://docs.google.com/spreadsheets/d/1AqS_DAThPUJuS2L2E-S5X7fM1kpIdhXQdBDZUyt-bWM/pubhtmlCopy your link and save it somewhere. We will need it in just a second.
Now we’re ready for R. Here are the packages I used:
# load libraries

library(dplyr)
library(tidyr)
library(RCurl)
library(ggplot2)
library(DT)
library(pander)
Scrape
We will use the RCurl package to scrape the data. The command we need is getForm(). The first arguement represents the URI to which the form is posted. You can just use the one shown below for a google sheet. The important part here is the key arguement. You need to copy it from the link you saved above. The key can be found in the last part of the link. Here is my link again:
https://docs.google.com/spreadsheets/d/1AqS_DAThPUJuS2L2E-S5X7fM1kpIdhXQdBDZUyt-bWM/pubhtmlSpecifically we want:
1AqS_DAThPUJuS2L2E-S5X7fM1kpIdhXQdBDZUyt-bWMTherefore we can delete https://docs.google.com/spreadsheets/d/ from the beginning, as well as /pubhtml from the end. Check the key arguement below. Finally, we use the read.csv() command to import the data.
# scrape data

sheet = getForm("https://spreadsheets.google.com/spreadsheet/pub",
                hl ="en_US",
                key = "1AqS_DAThPUJuS2L2E-S5X7fM1kpIdhXQdBDZUyt-bWM",
                output = "csv",
                .opts = list(followlocation = TRUE,
                             verbose = TRUE,
                             ssl.verifypeer = FALSE))

df <- read.csv(textConnection(sheet))
Let’s see if it worked…
pandoc.table(df, style = "rmarkdown", round = 2)| subj | group | score |
|---|---|---|
| 1 | mono | 81.99 |
| 2 | mono | 88.47 |
| 3 | mono | 80.31 |
| 4 | mono | 99.76 |
| 5 | mono | 89.64 |
| 6 | mono | 80.44 |
| 7 | mono | 90.9 |
| 8 | mono | 92.91 |
| 9 | mono | 91.61 |
| 10 | mono | 84.56 |
| 11 | mono | 99.09 |
| 12 | mono | 90.12 |
| 13 | mono | 82.03 |
| 14 | mono | 69.28 |
| 15 | mono | 96 |
| 16 | bi | 93.87 |
| 17 | bi | 93.95 |
| 18 | bi | 96.83 |
| 19 | bi | 96.46 |
| 20 | bi | 95.78 |
| 21 | bi | 96.76 |
| 22 | bi | 96.35 |
| 23 | bi | 94.22 |
| 24 | bi | 88.03 |
| 25 | bi | 95.86 |
| 26 | bi | 93.83 |
| 27 | bi | 93.53 |
| 28 | bi | 89.59 |
| 29 | bi | 92.57 |
| 30 | bi | 95.25 |
Looks good. Now we can visualize and analyze the data.
df %>%
  ggplot(., aes(x = as.numeric(group), y = score)) +
  scale_x_discrete(limits = c(2, 1), labels = c("Bilingual", "Monolingual")) +
  geom_jitter() +
  geom_point() +
  geom_smooth(method = "lm") +
  labs(x = "Group", y = "Score")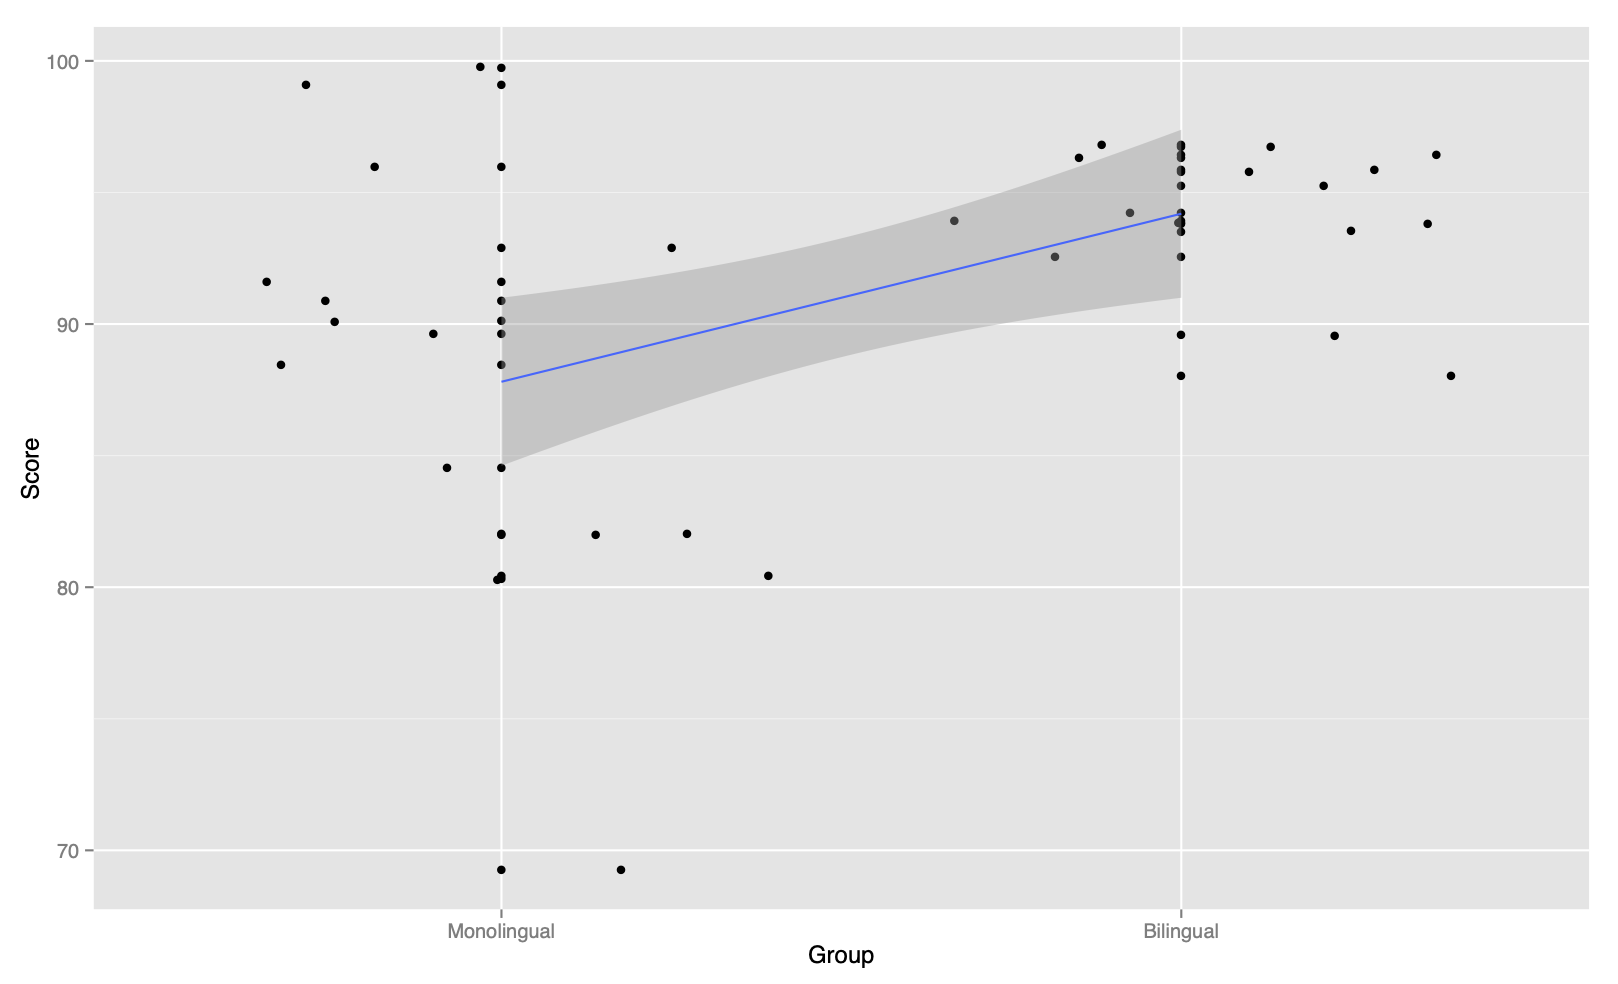
And that’s it.